
Marked 5 years ago onto SharePoint Charts

Category:
Software
qChartView helps create visually compelling SharePoint Charts and dashboards that include dynamic filtering, drill-down reporting. Customize chart elements such as fonts, labels, backgrounds, canvas, logos, tooltips and much more to create a rich user experience to satisfy a wide range of visual, BI and dashboard requirements.
You may like

8000.00
Gain practical administration skills including server management, security, metadata, monitoring, troubleshooting, and…
education, Technology, services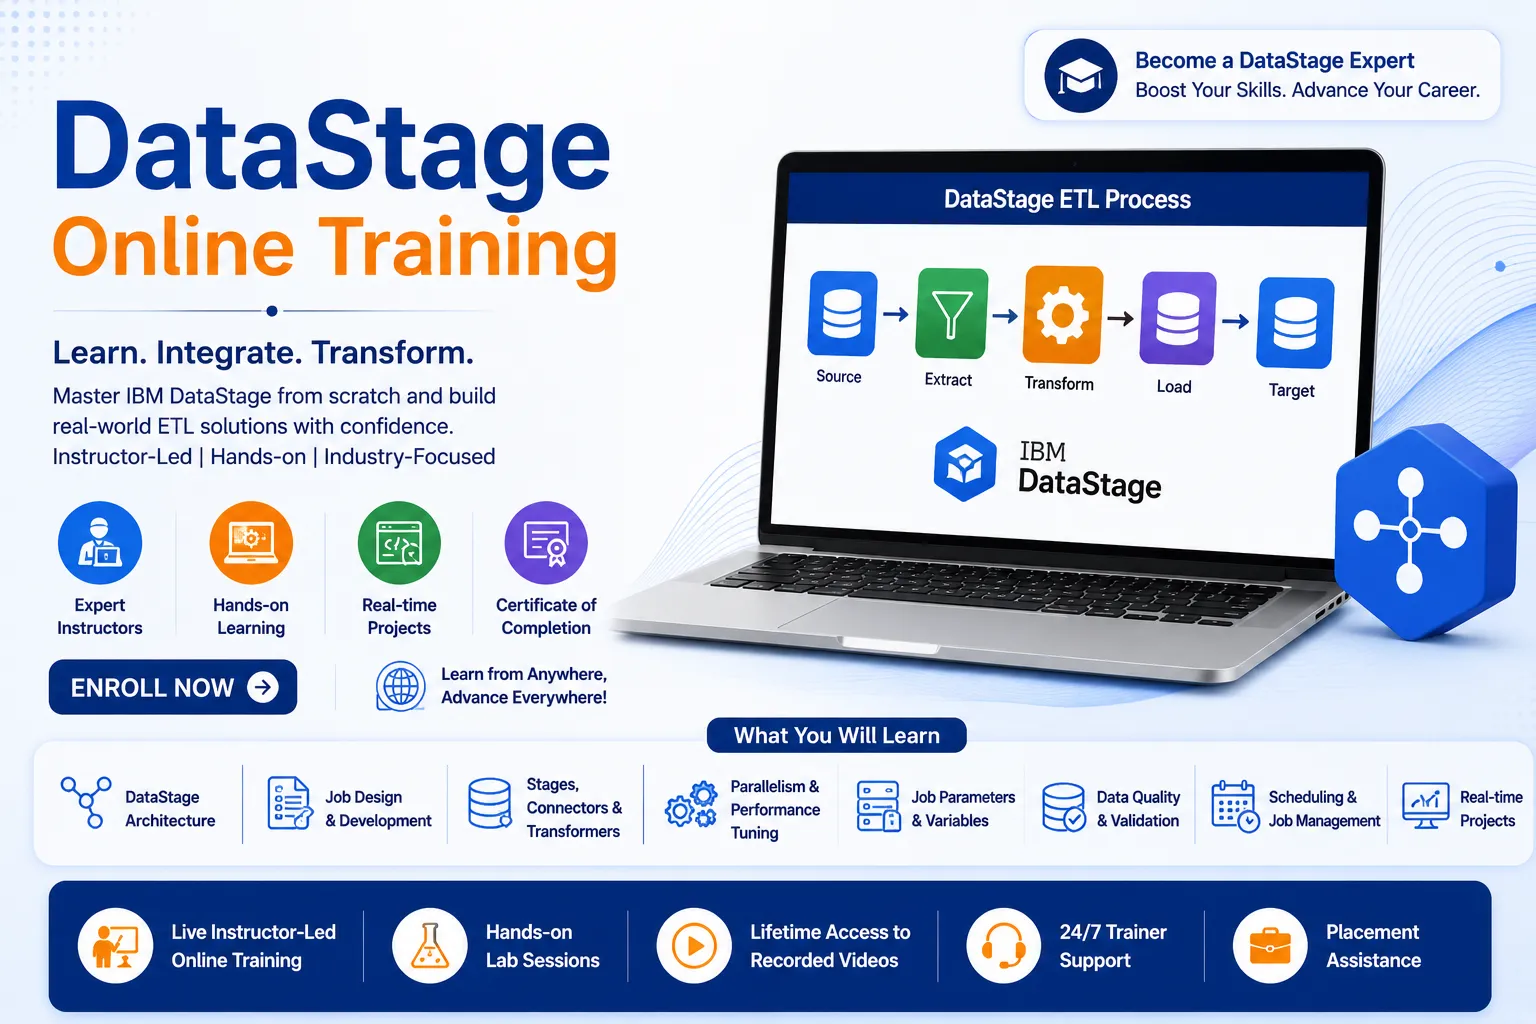
8000.00
DataStage online training combines flexible learning with practical ETL projects covering job development, scheduling,…
education, Technology, services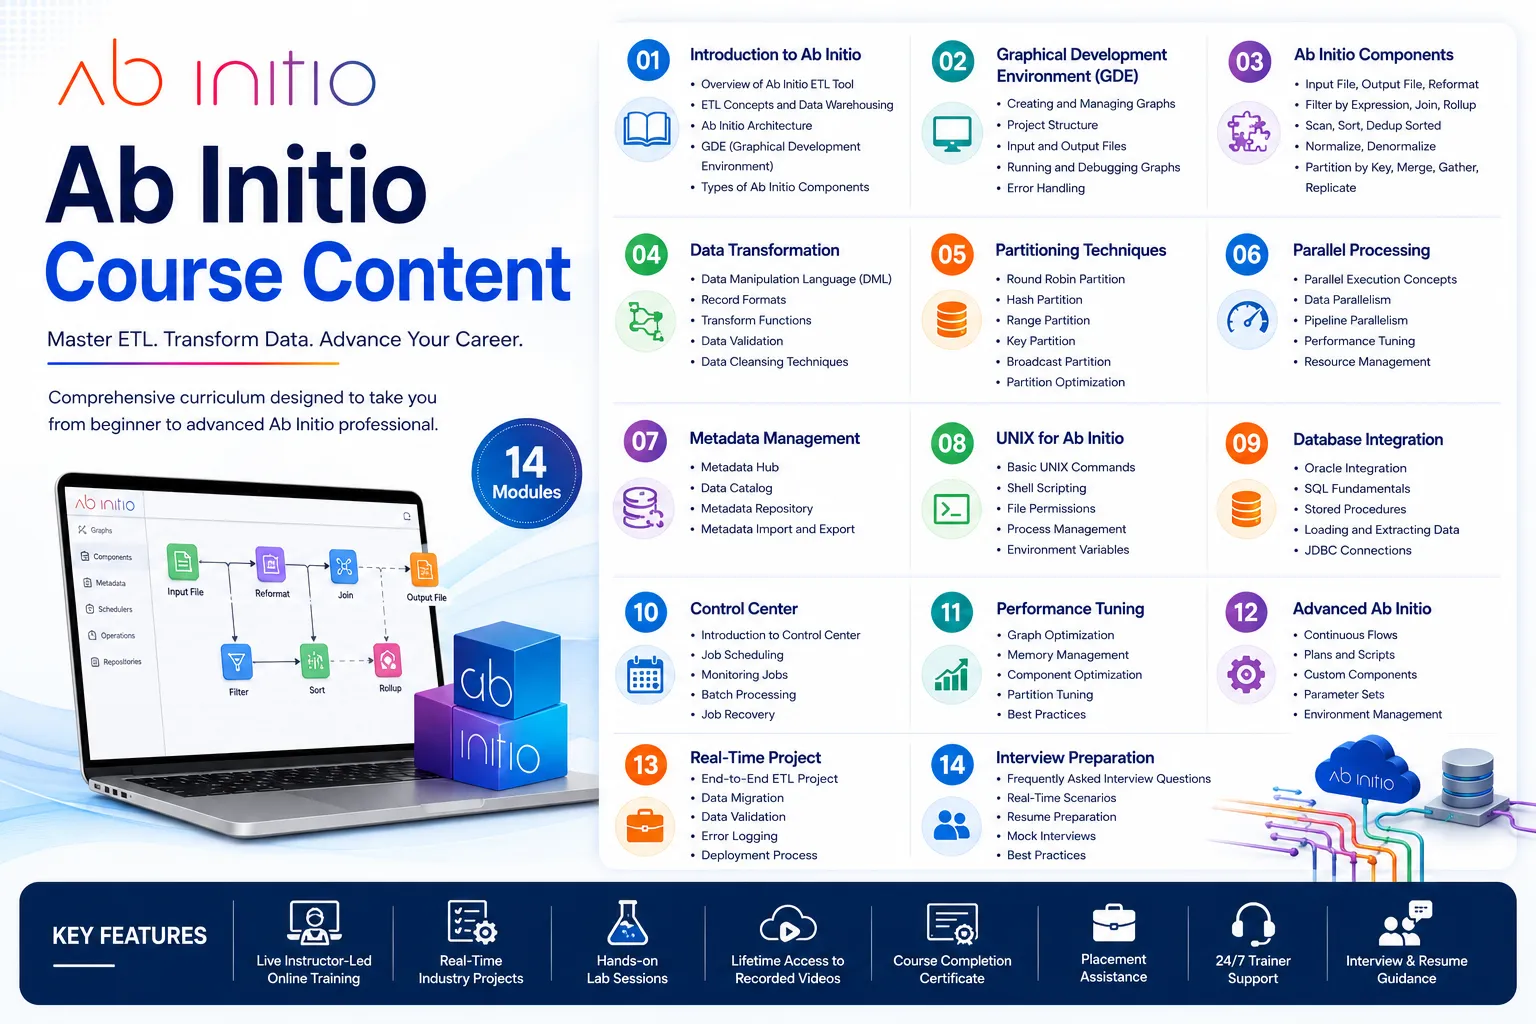
8000.00
Ab Initio course content includes ETL architecture, graph development, metadata management, transformations, debugging,…
education, Technology, services